Ohio’s 2026 school report cards show gains in reading, math, attendance
New Ohio report cards show statewide five-year highs in English language arts and math, lower chronic absenteeism, and stronger postsecondary readiness. But several of the state’s largest urban districts still posted overall ratings between two and three stars, making the subgroup and component data more useful than the headline star count alone.
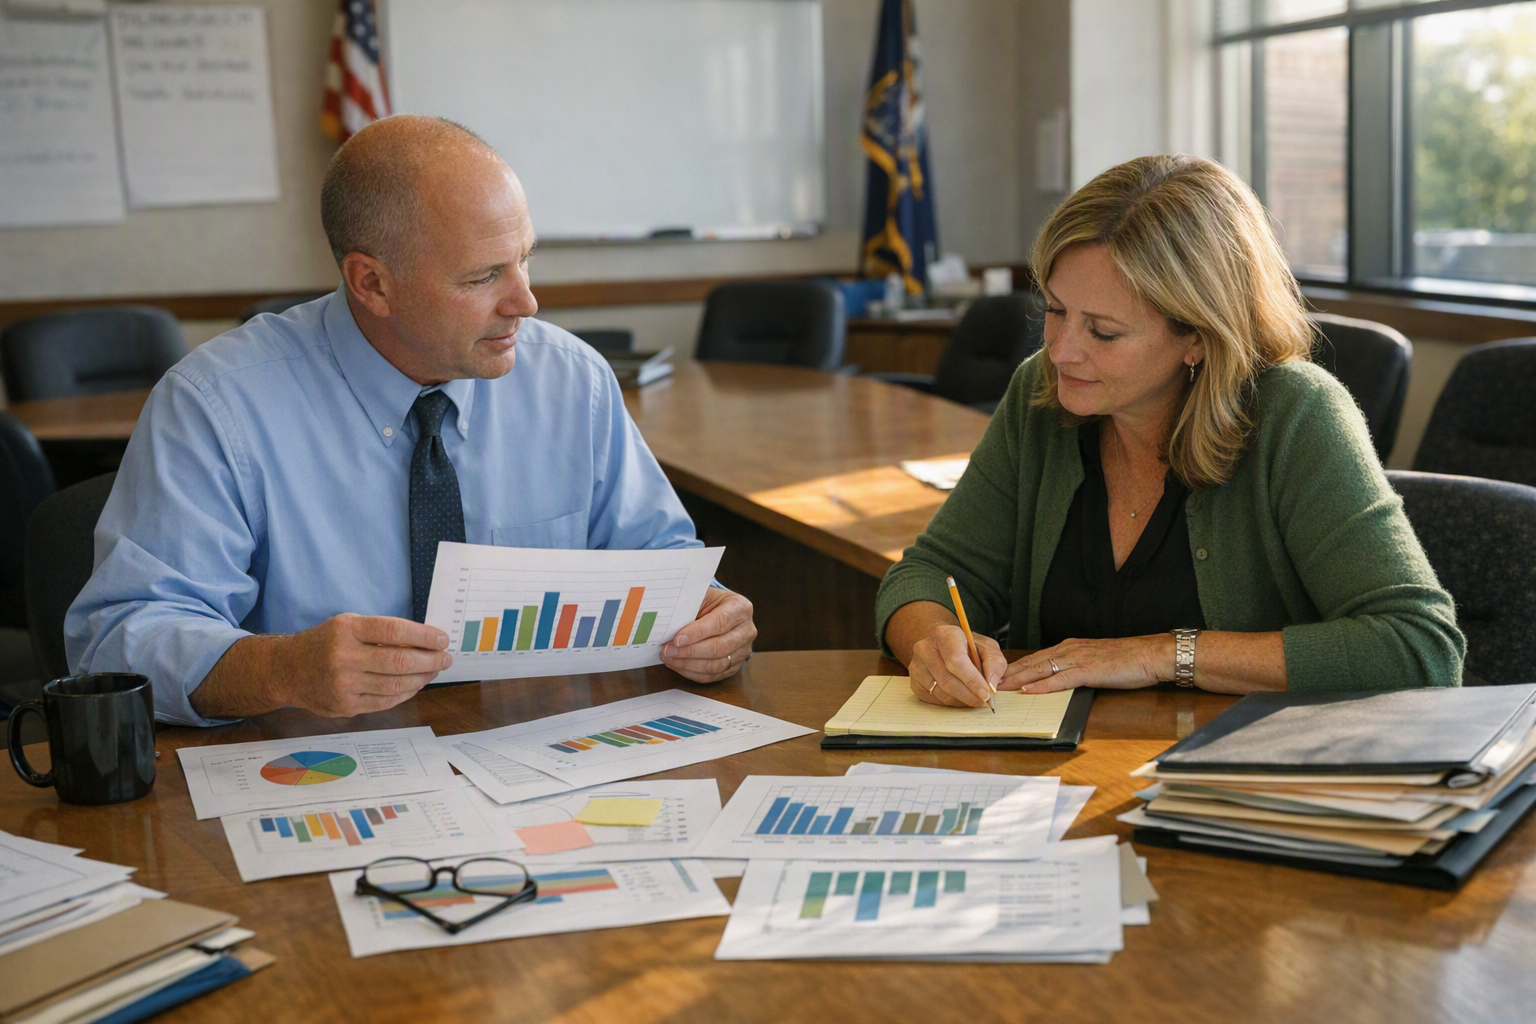
Ohio’s 2026 school report cards, released Sept. 15, show Ohio students posting their strongest statewide reading and math results in five years, with English language arts proficiency rising to 62.2% and math proficiency to 56.4%. The release also showed chronic absenteeism continuing to fall and more graduates meeting a postsecondary-readiness benchmark. But the same report cards underscore a harder truth for district leaders: statewide improvement is not yet showing up evenly, especially in several of Ohio’s largest urban systems. (education.ohio.gov)
The Ohio Department of Education and Workforce published report cards for districts, schools, community schools, career-technical entities and dropout-recovery schools. Traditional districts and schools receive overall ratings from one to five stars, in half-star increments, based on six components: achievement, progress, gap closing, early literacy, graduation, and college, career, workforce and military readiness. This year, 61 of Ohio’s 607 K-12 public school districts earned five stars overall. (education.ohio.gov)
Statewide gains, with the state pointing to literacy policy
State officials are explicitly connecting the gains to the first full school year of Science of Reading implementation. In its Sept. 15 announcement, the department said literacy proficiency rose across every student demographic group, while math proficiency increased in nine of the 10 groups it tracks. The department also pointed to the expansion of the ReadOhio coaching network to 140 coaches serving more than 200 schools. That does not prove the literacy push alone caused the gains, but it does make 2026 the first report-card cycle in which Ohio’s reading overhaul can plausibly be discussed alongside statewide outcome movement rather than just implementation. (education.ohio.gov)
The readiness and attendance numbers matter just as much for schools planning this fall. The state said more than two-thirds of the Class of 2025 earned at least one of Ohio’s 11 postsecondary readiness measures, marking a third straight year of improvement. Chronic absenteeism fell to 23.9%, down from 30.2% in 2021-22. That is meaningful progress, but it still leaves nearly one in four students missing at least 10% of the school year. Ohio’s own state summary frames the long-term target far lower: 12.8% chronic absenteeism by the end of 2028-29. (education.ohio.gov)
For superintendents and principals, that mix of gains should shape how this year’s release is read. Better proficiency scores suggest more students are mastering grade-level work. Better attendance suggests more students are in position to benefit from instruction in the first place. Better readiness numbers suggest more schools are translating high school completion into credentials, dual-credit success, technical skill proficiency, or other outcomes that matter after graduation. In other words, the report cards are pointing to improvement at multiple stages of the pipeline, not only at testing time. (education.ohio.gov)
Big-city districts still complicate the celebratory story
The statewide narrative gets less comfortable when the lens narrows to Ohio’s largest urban districts. Columbus City Schools improved to 2.5 stars from two stars, with WOSU reporting that student growth, especially in English language arts, helped drive the increase. Cleveland Metropolitan School District held at 2.5 stars. Cincinnati Public Schools reached three stars for the first time, meeting the state standard. Dayton Public Schools, however, still received an overall rating of two stars. (wosu.org)
Those ratings matter beyond headlines because large urban systems educate a disproportionate share of the students Ohio most needs to move: students from low-income families, English learners, students with disabilities, and students whose achievement was hit hardest by pandemic disruption. A statewide increase can coexist with stubbornly low ratings in those districts because Ohio’s accountability system measures both status and improvement. A district can show stronger growth and still remain well below the proficiency levels seen in more affluent suburbs. That appears to be part of what happened this year in Columbus and Cleveland. (education.ohio.gov)
That tension is also why educators should resist reading the report cards as a simple scoreboard of “good” and “bad” districts. Ohio’s own report-card site says the ratings are only one part of the state’s education story and should be read alongside school visits, conversations with educators and families, and school-level context. The ratings are useful because they force common statewide measures onto every district. They are limited because they compress very different instructional realities into a single star total. A district can be improving in growth, graduation, or readiness while still struggling badly in early literacy or raw achievement. (reportcard.education.ohio.gov)
For building leaders, that is the practical takeaway. The most actionable part of the release is not the overall star count but the component and subgroup data underneath it. A district looking at a 2.5- or 3-star overall rating may find that absenteeism is improving but early literacy remains weak, or that graduation is strong while middle-grade math is not. That is the level where fall improvement planning gets real: staffing coaches, adjusting intervention blocks, tightening attendance outreach, or rethinking how readiness measures such as industry credentials and dual-credit participation are being tracked and supported. (education.ohio.gov)
What remains uncertain in this year’s data
Two caveats should keep readers from overinterpreting the 2026 results. First, Ohio changed how the early literacy component is calculated under House Bill 96. For report-card purposes, some exemptions that still allow a child to be promoted to fourth grade no longer count toward the promotion measure in the component calculation. The department says that change affects ratings, not whether students can actually be promoted. So year-over-year comparisons on early literacy are not entirely apples to apples, even when local educators experience them that way. (education.ohio.gov)
Second, the state is separately investigating spring 2026 testing anomalies. Ohio first opened the inquiry after Columbus City Schools self-reported irregularities at two high schools, then expanded it on Sept. 4 after identifying significant anomalies at 52 additional school buildings statewide that may warrant further investigation. That does not negate the statewide gains, but it does mean some school-level results are arriving with more uncertainty than usual. (education.ohio.gov)
The immediate consequence for educators is that Ohio has handed districts fresh accountability data at exactly the point in the school year when improvement plans, coaching calendars, and intervention rosters are being set. The bigger question is whether this year’s statewide gains — especially the literacy bump after the first full Science of Reading year — can stick long enough to move more of the state’s large urban systems above the minimum standard, not just nudge the statewide averages upward. Ohio’s Sept. 23 report-card overview webinar will help districts parse the mechanics. The harder work will happen after that, in classrooms and buildings trying to turn a better state picture into stronger local outcomes. (education.ohio.gov)
More from K-12

Poughkeepsie adopts one K-8 curriculum to replace a patchwork
The district approved HMH across K-8 just before the new school year, pairing the switch with teacher training, parent progress access, and repeated implementation support.
During COVID closures, first graders did better with more teacher contact
A peer-reviewed study of 2,740 first graders in Germany found no overall achievement drop in this sample, but students with more teacher contact had stronger math results and smaller language-motivation losses. The sharpest risk appeared when low contact overlapped with low socioeconomic status.

Google Classroom’s new role-based homepage starts rolling out July 27
The redesign gives teachers, students, and administrators different default dashboards, but analytics and Gemini-linked tools still depend on licensing, settings, and user eligibility.